
May 13, 2006
Probability and Predictions
One of the things that has bothered me for some time now is how people make and communicate predictions about the future. To pluck an (important) example from the headlines, the CIA and other intelligence analysts have said that Iran is 5 to 10 years away from being able to build a nuclear bomb. But, even though this number has been quoted hundreds of times, there is never any context to explain what it means. While it's all obviously fuzzy, and in the end of the day someone just looks at all the evidence and puts a number on, it would be nice to be told what is being claimed with those numbers. Is it some kind of confidence interval? "We believe there is a 95% chance that Iran will produce a bomb in more than 5 years but less than 10 years." Is it something else? If we wanted a 99% confidence would it jump to 1 to 30 years, or 4 to 11 years? I'm reminded of the silly little probabilities that Gartner Group pioneered in their industry research ("Microsoft will delay the release of Window 98 until 1999 (0.8 probability)"). I thought those were kind of dumb at the time, but at least you had some sort of indication how sure the analyst was. And you could have, with some work, measured how good of a job she did both in making predictions and in assigning probabilities. But it's still pretty lame as far as imparting information that's useful for making decisions. Even the weatherman hasn't moved past using simple probabilities for chance of rain on a given day. While that may be the best measure for planning a picnic, it's not going to do you much good if you're trying to gauge the chance of a drought (you can't just add up the "chances of rain" each day because they are not independent events). So, what would a good tool for communicating the likelihood of an uncertain future event? Well, returning to the Iranian nuclear program issue, here's what I'd like to see: a distribution showing the cumulative probability of them building a bomb over time. Preferrably, we get to see a pretty little graph, and we'd get one from several sources. Here's an example of what one might look like for the Iranian bomb: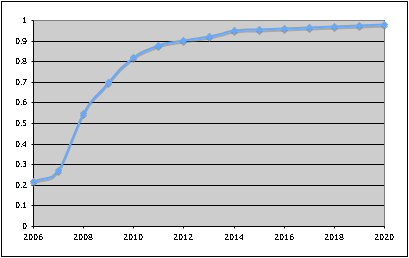
How is this better than what we get in the news? Well, first of all, I can look at it and see that the analysts think there's a one in five chance they already have a bomb. Second, as a policy-maker or voter, I can set my threshold for what cumulative probability I'm willing to tolerate before "drastic measures" need to be taken. Also, I can see which years the slope is highest, which might indicate the timing of any action taken. In addition, analysts could make multiple versions of the graph with different assumptions in place and show us side-by-side what the effect would be. So we could have one graph that showed the distribution if there's a secret military project that's been ongoing since 2003 vs. if the public program is all there is. Now, it's still not perfect. It's intelligence work, and it's only as good as the information, assumptions and analysis that goes into it. And there's no easy way show confidence in the individual assessments that make up the overall distribution (for instance, the assessment that there's a 20% chance that they already have a bomb makes a big difference in the graph, at least in terms of absolute magnitudes – how good was the information that informed that decision vs. the rest?) But, to me, it's much better than "they are five to ten years away from a bomb". Anyway, comments from the mathematical and policy oriented? Posted by richard at May 13, 2006 12:16 PM
From the mathematical and policy oriented:
yes, that would be nice.
I'm not sure what else to say. From "five to ten years away" I infere a positive probability that they've already got one or are very close. We have no way of knowing for sure what they have and don't have and this business of determining how long it goes from a certaing amount of enriched uranium to a larger amount to a bomb seems pretty crude. After all, Pakistan has one, and all it really takes is one truck through the mountains . . .
My guess is that they don't want to convey any more information that they do. It keeps everyone in the dark (something they want) and minimizies their chances of looking foolish if evidence arises to the contrary.
Weather forecasting could be done better, but the market of people who would understand it is probably too small for anyone to care . . . I assume the 10-day forecast is some sort of most liekly scenario, which fluctuates significantly with new data. Several reported items (eg, rain tomorrow, rain the next day, sun the following day) are often all dependent on one variable (eg, how long it takes for that giant storm cloud to ass through). Presentation would be difficult I think, but I would at least like to see, say, the three most likely 3-day scenarios with probabilties attached (eg, heavy rain today and tomorrow followed by sun the next day 50%, heavy rain today followed by light rain tomorrow 20%, heavy rain today and light rain today and tomorrow 20%, other 10%). That way you can see the dependencies and better prepare your weekend.
As for predicting droughts, please.
Posted by: Mike F. at May 13, 2006 05:11 PMAre you trying to drum up support for tactical strikes on Iran? This post looks like an example of the "mere exposure" theory of communication.
But your description is not too far off how fmr SecDef Perry described the Bayesian decision making process that he advocates for making strategic decisions. These kind of intelligence estimates are not made for public consumption, only internal evaluations of choices.
My only problem with them is that this kind of analysis can give decisionmakers a false sense of confidence. I shudder to imagine what the probabilities must have looked like attached to the decision tree for WMD in Iraq. (Under the best case scenario that the intel estimate was an honest error.)


